Magnetometer Viby
Viby (Sollentuna), Sweden · geographic coordinates: 59°27' N 17°54 E · geomagnetic coordinates (2017): 57.69°N, 106.22°E

 home  magnetogram database  Bartels plots  magnetometer Haimhausen  Polarlichtforum (AKM e.V.)


Analyses of Magnetometer Viby data towards online determination of auroral substorms

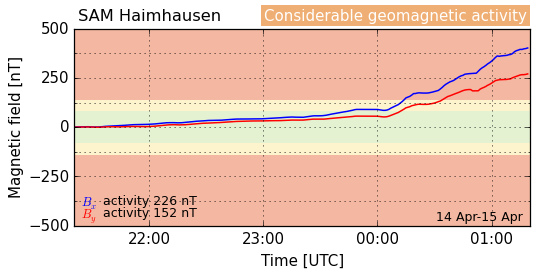
This plot shows the evolution of the horizontal magnetic field components within the last four hours. Depending on the activity within the last hour, green/yellow/red alerts are displayed in plot.

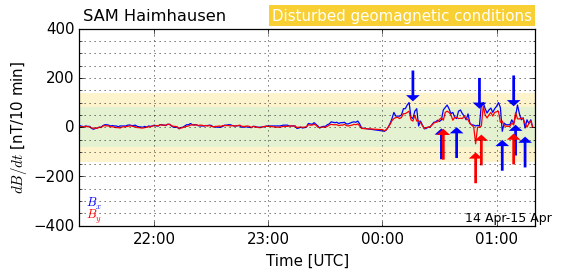
Alert criteria used in the above plot assess the last 60 minutes:
Quiet geomagnetic conditions Disturbed geomagnetic conditionsons Considerable geomagnetic activity
Within the last hour, less than ΔB<80 nT, corresponding to <K3 Within the last hour, less than ΔB<140 nT, corresponding to K4 Within the last hour, ΔB>140 nT, corresponding to K5

This plot shows the derivative of the magnetic field evolution, dB/dt. Peaks in it hint at a fast change of the magnetic flux, which is a neccessary condition for the occurrence of polar lights. Depending on the activity within the last four hour, green/yellow/red alerts are displayed in plot.

Alert criteria used in the above plot assess the last four hours:
Quiet geomagnetic conditions Disturbed geomagnetic conditionsons Considerable geomagnetic activity
Outburst less steep than ΔB<40 nT/10min Outburst less steep than ΔB<80 nT/10 min Outburst less steep than ΔB<240 nT/10 min Outburst less steep than ΔB>240 nT/10 min

In the plot, also high values of the second derivative, d2B/dt2 will be marked (by arrows). These characterize rising and falling wings of magnetic substorms, and may allow to identify a substorm earlier than just the first derivates.


Absolute magnetic field measurements and H/D components of Magnetometer Viby data


This plot shows the usually published components of the magnetic flux vector, H and D. Once SAM Viby will be promoted to a 3-D readout, also F, I and Z can be derived.


Current trend data for transfer to the SAM magnetometer network

The data format follows the format put forward by the German magnetometer network at polarlichtinfo.de. This network provides a central data analysis of German SAM stations. By a common analysis false alarms of individual stations can be effectively avoided. These data resemble dB/dt data with a step width of Δt=5 min, which can be useful for aurora borealis prediction as put forward in a blog by Steve Marple of Aurorawatch UK.

To facilitate an online analysis for central/northern Europe, recent magnetometer data is provided here. These data describe te evolution of the horizontal components of the local magnetic field within the last hour.

Haimhausen
48.27N 11.68E
se.gner.cc/sam/
19.03.24
K: 4 5 5 2 - - - - 
08:49 - 09:49 UT
Min. X Y Trend
now +258 +182 o
- 5 +257 +182 o
-10 +257 +183 o
-15 +262 +186 o
-20 +265 +190 o
-25 +272 +195 o
-30 +279 +202 -
-35 +280 +205 -
-40 +283 +210 -
-45 +284 +216 -
-50 +280 +213 -
-55 +276 +209 -


Magnetometer
K value
5-
Archiv & Analysen
Jahresübersicht K-Werte
Magnetogramm-Datenbank
Logging-Fehlerraten
Aktueller Trend
Korrelation Haimhausen-Kp
SAM Haimhausen Logbook

Letzte Aktualisierung dieses Dokumentes: