|
Magnetic Observatory Haimhausen Haimhausen, Germany · geographic coordinates: 48°18' N 11°33 E · geomagnetic coordinates (2017): 43.33°N |
|
|
| |
|
Explain these plots!
This magnetometer is located in Haimhausen, about 15 km north of Munich, Germany.
It measures the horizontal components of the Earth's magnetic field.
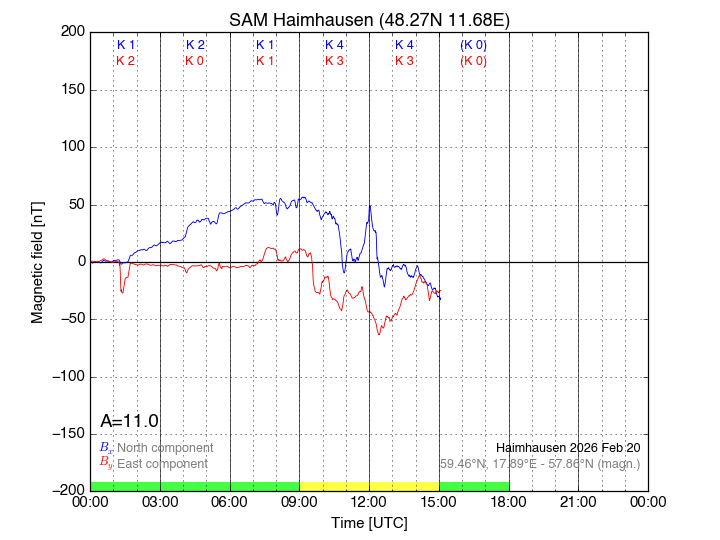
The above magnetogram shows the
development of the local magnetic field and allows to draw conclusions
particularly on the probability of observing norther lights (aurora borealis)
at the location of the magnetometer. The data analysis is based of
self-developed python and perl code.
The magnetogram shows intensity variations
with time of the geomagnetic field in Viby. The rather small variations are primarily caused by the solar
wind, which continuously moves onto the Earth's magnetic field. Changes in its velocity, density and
magnetic orientation influence orientation and intensity of the geomagnetic field.
The disturbance of the magntic field can have a considerable effect on the distribution of
electrically charged molecules in the ionosphere (upper atmosphere) which gives rise to northern lights. The
magnetometer is able to measure effects much smaller than causing aurora, which makes it an interesting tool for
forecasting northern lights.
| |
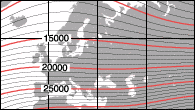
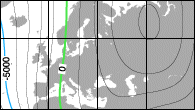
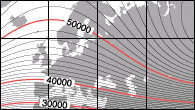
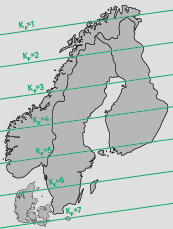
Strong disturbances caused by solar activity are usually seen in the horizontal components of the magnetic field. The vertical component can be used to infer the location of the electrojets. These electric currents run along the auroral ovals and are, give and take, responsible for all magnetic disturbances resulting from magnetic substorms close to the surface. Hence changes in the vertical component represent a good measure for the strength of local substorms. More about K values and the auroral ovalThe K index is a measure of the maximum fluctuation of the horizontal magnetic field component ΔBH in fixed three-hour intervals. It is a historically-grown historisch gewachsenes, quasi-logarithmic measure of the occurrence probability for polar lights. It is calculated as the difference of maximal and minimal magnetic field strength in eight predefined 3-hour intervals per day. The association of K values and disturbance size is chosen dependent on the latitude of the magnetic observatory in a way so that the statistical distribution of worldwide K values is reached. This means that K is an universal measure for polar light probabilities, and also that stations at higher (geomagnetic) latitudes require larger fluctuations to reach a given K level. For a given disturbance of the geomagnetic field, K values remain combarable globally. This also allows for computing a global, so-called planetary Kp Index (Kp Indices from 1868 on). Disturbances on the K scale can roughly be translated in how far south the auroral oval will reach according to this map. Basically, for disturbances equivalent to K7 or greater (G3-level storms) there is a small chance for northern lights in southern Germany. For a fair chance of observing northern lights in northern central Europe, a level of K8 should be reached. Only from K9 the chances for visible aurora in Southern Germany are high. It is a good idea to also consider local circumstances at other magnetometers, like SAM Stockholm. SAM Haimhausen measures the evolution of the x and y components of the Earth's magnetic fields. As only the relative changes with respect to the values at 00:00 UTC are regarded, an absolute calibration against long-term drifts of the instrument is not required. To determine the K value, SAM Haimhausen uses this conversion, appropriate for latitudes on the transition between mid and high latitudes:
| ||||||||||||||||||||||||||||||||||||||||||||||||||||||||||||||||||||
| Magnetometer data products | |||||||||||||||||||||||
| Current alert status | |||||||||||||||||||||||
| NOAA watch | |||||||||||||||||||||||
3-day spaceweather prediction:
|
|||||||||||||||||||||||
| IMF information | |||||||||||||||||||||||
|
Source: NOAA/SWPC/DSCOVR |
|||||||||||||||||||||||
| Links | |||||||||||||||||||||||
|
Aurora borealis information SAM stations |
|||||||||||||||||||||||
| Current Environmental Data | |||||||||||||||||||||||
| Current Astronomical Data | |||||||||||||||||||||||

This service is based on Simple Aurora Monitor, designed by the SAM project by Karsten Hansky and Dirk Langenbach.
Parts of the hardware have been generously donated by Ralf Pitscheneder and had been previously used at polarlichtinfo.de.

![]()
Running SAM_linux & SAManpy software by Robert Wagner, powered by python on Raspberry Pi
